AI that finds the root cause of your incidents — instantly
Coroot uses eBPF to connect in minutes. No code changes needed. It shows you exactly what broke, why it happened, and how to fix it.
Trusted by SREs and DevOps teams around the world


Observability shouldn't feel like detective work.
Tons of tools, zero clarity
Metrics here, traces there — and the answer? Nowhere.
Alerts that scream but don't explain
You know something's broken. But what and why? Good luck.
Fixing takes minutes — finding takes hours
Root cause analysis eats up your day. Again.
Coroot finds the root cause for you.
How Coroot Helps You Troubleshoot Instantly
Install it and start collecting
Drop in Coroot with its eBPF agent. No code changes needed. It starts collecting metrics, logs, traces, profiles, and events in minutes.
Get full visibility in one place
Coroot shows everything that matters, including 3rd-party, black-box, and legacy services, all connected across your stack.
Detect real problems, not noise
Outages, slow services, error spikes — Coroot highlights the issues that actually impact your system.
Let AI explain the root cause
Coroot's AI analyzes the data to explain what happened, what changed, and how to fix it clearly and instantly.
See It in Action
See how Coroot's automated Root Cause Analysis helped engineering teams quickly resolve complex production issues that would have taken hours to debug manually.
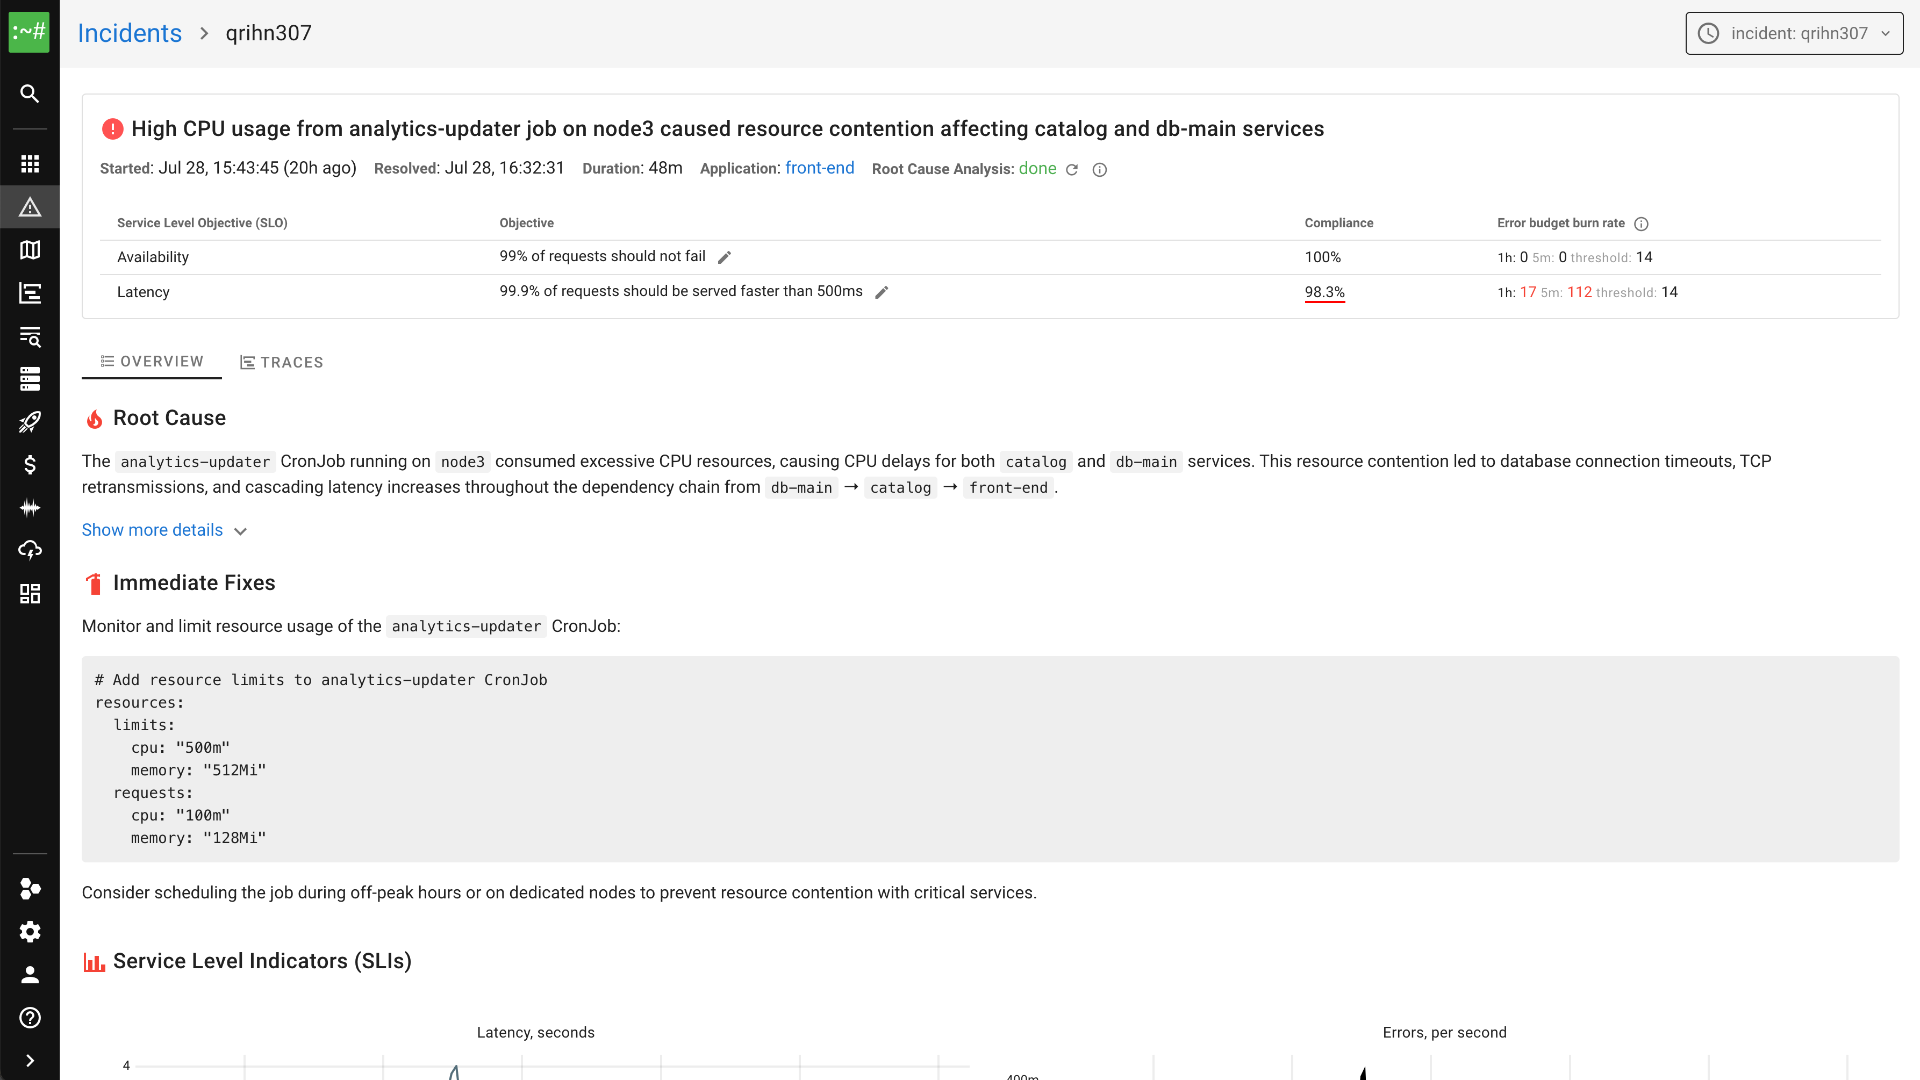
CPU Saturation Incident
High latency in front-end service caused by CPU saturation on node3, affecting catalog and db-main services.
Read Full Case StudyNetwork Chaos Experiment
Network chaos experiment causing latency spikes in front-end service through catalog-db-main dependency chain.
Read Full Case StudyCatalog Service Deployment
Catalog service deployment caused performance issues due to CPU resource contention and database connection problems.
Read Full Case StudyWant to see how Coroot can help your team resolve issues faster?
Try Coroot for FreeSimple, Transparent Pricing
No surprise bills, no volume-based pricing. Pay only for the CPU cores you're monitoring — not for data or storage.
$1 per monitored CPU core/month
Simple pricing based on your cluster size, not data volume or ingestion rates
No credit card required
No Minimum Commitment
Start with any number of cores and scale as needed. No long-term contracts or minimum spending requirements.
Unlimited Data Storage
Self-hosted deployment means no storage limits or egress fees. Retain as much telemetry data as you need.
Everything Included
Metrics, logs, traces, profiles, and AI-powered root cause analysis. One price covers all observability features.
Why Teams Choose Coroot
It collects what others miss
Coroot's eBPF agent captures the deep, low-level signals that typical setups ignore — across your apps, infra, and even 3rd-party services.
Your data stays yours
Coroot runs fully in your environment. It uses AI to explain issues, but only sends minimal context — never raw telemetry.
Not just alerts — real answers
Coroot doesn't flood you with warnings. It shows you what happened, why, and how to fix it.
Works out of the box, everywhere
Kubernetes, VMs, legacy services — no code changes, no special setup. Just answers.
Observability teams love Coroot
"Coroot is one of the easiest observability solutions to recommend because it is both easy to install and feature-complete, delivering immediate value out of the box, all while being built on open standards. It's the first tool I install, even using it to observe my other observability tools."
"Coroot is a revolution in IT observability. This open source platform simplifies the analysis of metrics, logs and traces, providing valuable insights and unparalleled simplicity."
"For engineers and SREs tired of sifting through endless logs and fragmented metrics, Coroot offers a refreshingly intuitive yet powerful approach to modern observability."
"Coroot is the best open source observability stack you've never heard of. The out of the box experience is amazing. So much value with minimal effort."
"As someone who likes things simple that can be managed by large teams, I immediately loved Coroot. It's an amazing experience to set something up in less then thirty minutes and almost immediately attain a visual knowledge of containerized applications. And if there's an issue, their team reacts quickly."
"Coroot's use of eBPF technology for observability offers a powerful, user-friendly solution that enhances visibility, simplifies troubleshooting, and ensures your database operations run smoothly and reliably."
Ready to fix incidents faster?
Coroot shows you what broke, why it happened, and how to fix it — in plain English, within minutes of setup. It also gives you the evidence to cross-check — so you're never flying blind.